
Who doesn’t love a good old market crash? Every finance expert out there touts the message that you should be buying at the bottom and selling at the top. This is always great advice, especially if you know when the optimal time to buy is at the very bottom, or the optimal time to sell at the very top. Optimal trading strategies seem obvious in hindsight, but during the actual event when market volatility is extreme, it’s very difficult to predict when the “right” time to buy is, or even sell if you are trying to time that. That’s why sticking with a disciplined approach of dollar cost averaging into your portfolio over time is always the best strategy, or slowly averaging out of your portfolio as you near your retirement financial goals.
As eluded to in Lesson 39, if markets are down hugely from a peak, then yes it’s obviously not a bad time to deploy some free cash and buy into the markets and top up your portfolio. As a matter of fact, everything is probably on sale right now compared to a short time ago when the markets were a lot higher. Buying things on sale that fit your budget is a mentality we all probably have when we go shopping, and it isn’t much different when shopping for investments. However, many people focus too much on trying to pull of the optimal trade in their portfolio, and end up actually losing money, especially during increased times of volatility in the markets (just as we have been experiencing so far in 2020).
Let’s look at three so called “strategies” that seem obvious in hindsight to take advantage of and deploy to make a lot of money, but are in reality very difficult to execute and time correctly, and can become extremely costly as a result.
Timing Tops and Bottoms
Looking a historical graph of the TSX or S&P500, one might think to themselves that the buy low and sell high mantra is obvious. Individuals may try to time when to sell their investments at a top, and then buy back into them when the markets are at a bottom. Well it is and obvious strategy in hindsight, but when you are experiencing market movements in real time, it is impossible to predict when a market top or market bottom has been reached. Many individuals sell into what they believe to be the top of the market, only to miss out on much more upside movement over time. The approach of slowly “dollar cost averaging” in, or in other words, slowly putting money into your portfolio investments over time, will always work out in your favor. With this approach, there will be times when you buy near a top, but there will be times when you buy near a bottom. The investments purchased at a bottom will compound returns a lot better than shares bought at a top. Everything kind of averages out in the end, and your overall portfolio investments will simply mimic the underlying holding that you are buying anyway over the long term, without having to try and time your entry into it. This approach, while appropriate for any holding, is ideal for purchasing ETFs that track an index. You will always perform in line with the index that you are a buying an ETF for without having to stress out when to buy, or frankly, if and when to sell. For arguments sake, any portfolio should be meant for long term investments, and if you are well diversified across the market, you shouldn’t have to sell any position ever until you begin reaching retirement.
Leveraged ETFs
Building off of the first point, leveraged ETFs is all about timing as well. As mentioned in Lesson 26, leveraged ETFs are simply ETFs that track some underlying index or sector, but with a multiple attached.
Leveraged ETFs are constructed using derivatives and debt instruments to obtain a multiple of 2 or 3 on whatever index or underlying sector it tracks. A leveraged ETF that tracks the S&P500 can have a multiple of 2 or 3 associated with it, meaning that if the S&P500 goes up 1%, this leveraged ETF would theoretically go up 2% or 3% depending on the leverage. However, the opposite is true to. If the S&P500 goes down 1%, your ETF will go down 2 or 3% depending on the leverage. Now in order to breakeven, the S&P500 has to go up >1% for the leverage to work for you and break you even. Over time, leveraged ETFs decay because of the nature of the leverage. During long bull runs, leveraged bull ETFs perform well, but as soon as there is increased volatility in the markets, or there is a bear market, these leveraged ETFs collapse. The opposite is even more so true with leveraged bear ETFs .Take $100 dollars, and go up 2% and you get 102. Go down 2%, and you are at $99.96. Now do this over a long period of time and the decay becomes substantial.
Not only do leveraged ETFs decay over time, but the instruments don’t track perfectly the underlying sector or index either. This is mainly due to the higher expense ratios associated with leveraged ETFs. These instruments can produce substantial profits as a short term trade, but it does highly depend on the timing of entry and exit from the position. If you try to time a market bottom with a leveraged ETF and are off by 2 weeks, your position could become decimated quickly and would require substantial upside performance from the underlying index or sector in order to even break even with the ETF. Stay away.
Option Trading
Another form of leverage, and the most dangerous in my opinion if not timed correctly and executed strategically, is the use of options. In theory, many people view options as this magical instrument that can provide them with substantial returns, especially if timed correctly at a top or bottom (I will discuss the fundamental properties of options and how they can be used in a future article). Buy call options before markets go up, and buy put options before markets go down. Seems easy right?
Purchasing call options on a stock or ETF before it goes up will pay very handsomely. The same thing goes for puts on a stock or ETF before it plummets. Imagine looking back at February to March of 2020 and thinking how much money you could have made if you just bought put options on SPX. In fact, yes you would have made huge returns, especially if you held until the bottom of March. However, this “optimal” and unrealistic trade depends on 3 criteria that dictate the price of an option contract:
Expiration – the date in which the option contract expires will affect not only the price of the option, but how long a trader is willing to hold onto the option. If someone bought February 2020 monthly put option contracts, they would have had to either close their position or settle prior to or on that expiration date. This means that they would have “mistimed” the markets tanking by a week or two. However, the closer to expiration, the cheaper an option contract will cost, which may entice traders to buy to make a quick profit.
Strike price – the price of the contract that stipulates the price you are forced to purchase or sell the underlying security at on the expiration date. This will not only determine the price of the option you purchase, but the amount of profit/loss experienced through the trade. If I buy calls at 50 strike price on ABC when it’s trading at 45, there is a good possibility that ABC never reaches 50 by expiration date, and my contract goes to zero. However, if ABC reaches 50 and goes to 55, I will see huge returns on my position, warranted that haven’t sold the position yet.
Time Value and Implied Volatility – this is the most important factor to me because it is easiest reason to lose money on option trades. During calm times in the market, volatility will be low, and based on the Black Scholes model used for option pricing, option premiums will be low. However, when volatility in the markets spike, option prices spike and become quite inflated. For this reason, a trader may “overpay” for an option contract, only to see the premium decay over time as volatility falls and time value erodes, even if the underlying security is moving in the right direction that the trader accurately predicted.
I’ll put a disclaimer here for readers who don’t care for the intricacies of options and want to skip this next part in italics to the next section! I do love options theory and I do love talking about them so bear with me otherwise.
For example, this was the option spread for March monthly contracts on the VIX on February 28, 2020, when the VIX was rocketing upwards as markets fell, and reached around the 48 to 49 dollar range.
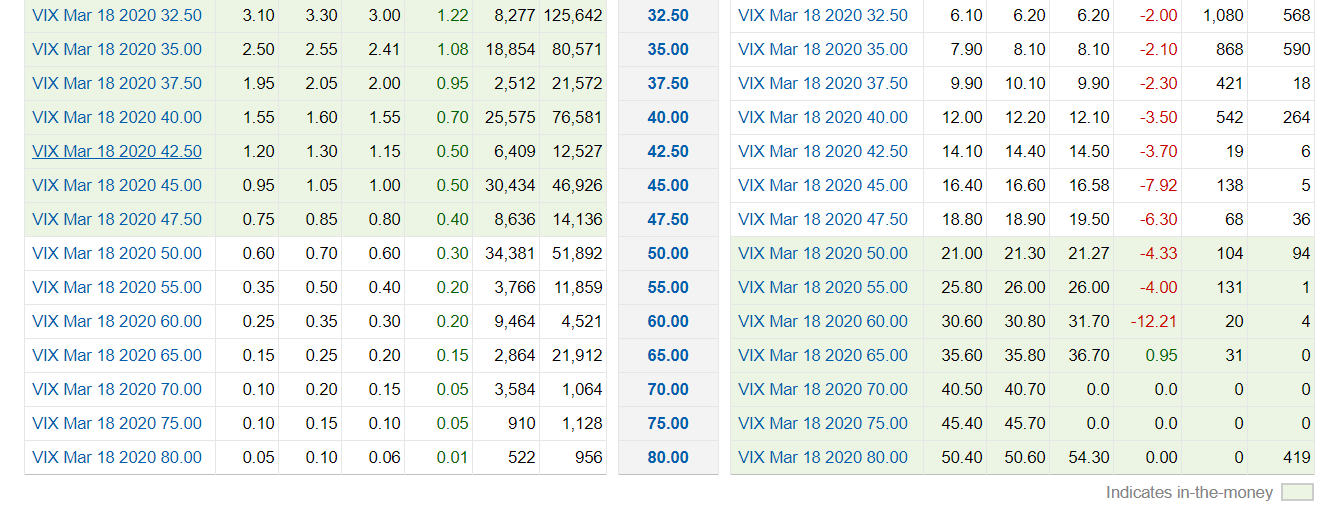
Figure 1: Option Spread on VIX (February 28, 2020) for March Monthly contract
You can see that to buy call options would be very cheap, yet put options were quite expensive. The sentiment here based on VIX futures prices, as well as the historical trend of the VIX, is that the VIX will eventually come falling down to levels where it typically resides at between 10 and 20. This is why put options are so expensive here. While the probability that the VIX will eventually come back down from the high 40s is almost a certainty, the unknown here is the question “when”. If a trader thinks this will happen by March 18, they can buy these March monthly put options. However, these puts will be extremely expensive. At the money put options are trading at $18.80 per contract. So in order to breakeven by expiration, the VIX will have to come down to at least roughly $29 by the expiration of this contract. Think about that… the VIX will have to fall 39% in order for this trade to break even. The VIX could go down only 20% and the trader will have been correct in their thinking to buy puts, but will likely lose money on the trade if held until expiration. However, a trader purchasing call options in the unlikely event that the VIX were to continue going up, would make a hefty return. It’s unlikely based on how cheap the option prices are, but if one were to look at a historical chart of the VIX, these so called “superspike” events only happen once every couple of years. (I draw a line in red at 30 to mark a superspike boundary).

Figure 2: Daily Chart of the VIX (February 28, 2010 – February 28, 2020)
Well as markets would have it, the unlikely did end up happening and the VIX spiked to levels in March not seen since 2008 during the financial crisis. Those call options made a lot of money for those that held on until expiration date.
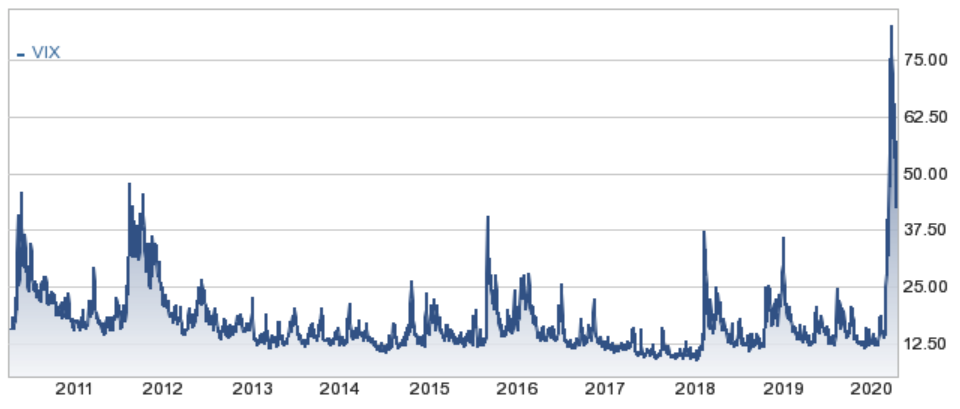
Figure 3: Daily Chart of the VIX April 4, 2011 to April 4, 2020
At the end of the day, options are very risky and can be extremely expensive, and if not timed appropriately or strategically executed, can leave you with a huge loss in your portfolio. Stay away and let the faint of heart trading “experts” trade the options market and lose money over it.
4. Timing – like leveraged ETFs and trying to time market entry and exit, timing is everything for buying and selling options. Because options are so leveraged due to its construction nature (each contract represents 100 shares of the underlying security), it’s easy for option premiums to swing wildly up and down over the duration of owning it. Knowing when to “get out” is extremely difficult to predict, and it’s extremely easy to miss out on huge gains due to selling early, or seeing your position go right to zero due to holding on too long. The charts of the VIX above perfectly illustrate this (now you have to go back and read the section you skipped!).
It’s so easy to get a feeling of FOMO when listening to the talking heads on various networks talking about buying at the bottom, selling at the high, and getting a sense of missing out if you don’t take advantage of market extremes. At the end of the day, no talking head, or anyone for that matter, can predict a bottom of a market crash or a peak of a market climb, and neither should you. Playing the waiting game (Lesson 17) and slowly putting more money to work over time and dollar cost averaging into existing positions will provide you with ample returns over the long run. The opposite works too when dollar cost averaging out of position and slowly liquidating your portfolio as you near retirement to free up cash. Trying to be a hero and making a ten bagger on VIX options or on a triple leveraged ETF that tracks the Energy Sector might work if you get the timing and pricing correct for both buying and selling. Chances are you won’t, and you will end up losing unnecessary amounts of money, and lose the real opportunity of buying more of the quality you already own in a diligent and disciplined manner. Don’t let hindsight get the better of you and guide your next emotionally driven decision.