The rent versus buy decision is one of the biggest financial crossroads most North Americans face, and it’s one of the most misunderstood. Too many people still treat home ownership as an automatic milestone on the path to financial security, so much so that it has become a religion in North America, even when the numbers no longer support that assumption.
In an era of high home prices, limited housing supply that has not kept up with demand since the 1980s, and strong long‑term stock market returns, renting can often be the more rational and flexible choice. The problem is that most people only compare a monthly rent price against a monthly mortgage payment, and ignore a long list of phantom costs that quietly erode the “equity” they believe they’re building when considering what is likely the biggest financial decision of their life.
For decades, the message around home ownership has been simple. “Renting is throwing money away”, “real estate always goes up”, or “you’re not truly stable until you own.” Those ideas were shaped by past conditions, which included lower home prices relative to income, lower interest rates for long stretches, and fewer flexible investment options for everyday people. Home ownership became a convenient forced‑savings plan in a world where it was harder to invest consistently in broad, low‑cost stock market index funds. Figure 1 shows this trend perfectly, with the median age of first time home buyers reaching 40 in 2025 in the United States (National Association of Realtors), and similar in Canada (Wowa). Figure 2 shows the steady rise in home price to household income ratio since the 1970s in the United States (Long Term Trends).
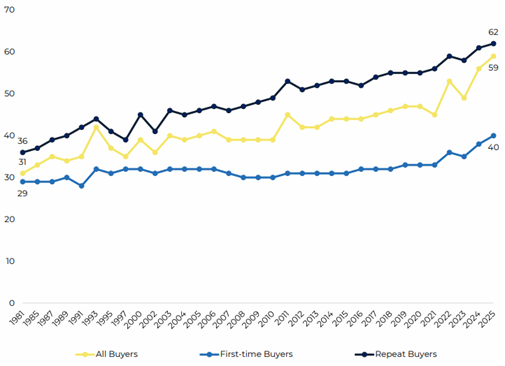
Figure 1: Median Age of Home Buyers (USA), 1981-2025
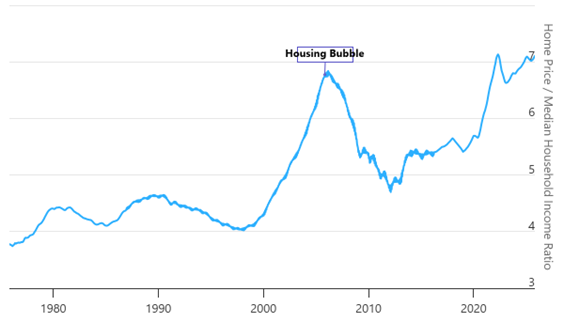
Figure 2: Home Price to Median Household Income Ratio (USA), 1975-2025
Today however, the landscape is very different. Broad‑market ETFs with little to no fees can be purchased from your phone. Many housing markets have seen prices decouple from local incomes, especially higher cost of living cities such as Vancouver and Toronto. Mobility and career changes matter more, making flexibility a financial asset. Yet the cultural script hasn’t caught up. People still feel pressure to buy, even when it stretches their budget and locks up capital that could otherwise compound in diversified investments. This often leads to homeowners feeling “house poor”, finding it difficult to afford other fixed and variable costs on top of a mortgage payment.
Phantom Costs of Home Ownership
When people compare renting and buying, they almost always stack monthly rent against monthly mortgage payment. That’s a flawed comparison because a mortgage payment is only one piece of the total cost of owning. There are other phantom costs that quietly eat into your home equity and potential for positive returns upon selling one day. Let’s dive into these primary phantom costs:
1. Mortgage Interest
In the early years of a typical 25–30 year mortgage, the majority of your payment goes to interest, not principal.
You might see your mortgage payment and assume you’re “paying yourself”
In reality, much of that money is paying the bank for the privilege of borrowing
Over the life of the mortgage, total interest paid can rival or even exceed the original purchase price, especially at higher rates and longer terms.
2. Property Taxes
Property taxes are a recurring, unavoidable expense tied to your home’s assessed value.
They often increase over time, either due to the rise in property value itself, a rise in the tax rate, or both
They can add hundreds of dollars per month when annualized
Renters don’t escape this entirely (landlords factor taxes into rent), but as an owner, you directly bear the full cost.
3. Home Insurance
Owners typically pay more for insurance than renters because they insure the full structure, not just personal contents.
Renter’s insurance mainly covers belongings
Home insurance must cover the building, liability, and often additional risks
That difference can be substantial on a yearly basis.
4. Maintenance and Repairs
Every component of a home deteriorates. Roofs wear out, furnaces fail, plumbing leaks, and exterior elements decay. A common rule of thumb:
Budget 1-3% of your home’s value per year for maintenance and repairs
On a 500,000 home, that’s 5,000–15,000 annually on average. Some years will be lighter; others will bring a major hit (e.g., roof or foundation issues). As a renter, these surprise expenses are the landlord’s problem, not yours.
5. Renovations and Upgrades
Very few homeowners simply buy a house and leave it untouched. Over an ownership period, many people will:
Remodel kitchens or bathrooms
Replace flooring and appliances
Finish basements or build decks and fences
Some renovations may increase resale value, but many largely reflect consumption (you enjoy them while you live there) more than pure investment. It’s easy to over‑spend and then later assume “the house went up in value” without realizing how much was actually you simply injecting fresh capital with little to no value add.
6. Transaction Costs When You Sell
Buying and selling real estate is expensive. Typical exit costs include:
Realtor commissions (often 4–6% of sale price in North America)
Legal fees
Closing costs, staging, and minor pre‑sale repairs
Each time you move, a chunk of your “equity” disappears into transaction friction. This is why short time horizons are usually where buying looks worst financially.
7. Opportunity Cost of Locked‑Up Capital
This is the least visible cost and often the largest over decades:
Your down payment, closing costs, and growing home equity are all dollars that could have been invested elsewhere
If instead you invested these funds in a broad‑based index (e.g., an S&P 500 ETF) and continued adding to it, the compounding effect over time can be massive
Homeowners sometimes say, “Yes, but I’m forced to save through my mortgage.” That’s true, but disciplined renters who invest the difference between renting and owning costs can build wealth just as reliably, and often more efficiently.
Is Renting Considered “Throwing Money Away”?
It’s easy to see rent as money disappearing, while equity feels like something you “keep.” That framing is incomplete. Both renters and owners pay for shelter. The difference lies in who bears which risks, who has flexibility, and how much capital is tied up.
Renting often includes:
No property tax bills in your name
No surprise roof, furnace, or foundation repairs
No large closing costs when you move
Minimal friction to relocate for a better job, lower rent, or lifestyle change
If your rent is significantly lower than the true all‑in cost of owning a comparable place, and you consistently invest the difference, renting can be the superior wealth‑building strategy, especially over short and intermediate periods.
For a quick sanity check, a helpful mental shortcut when comparing owning vs renting is the 5% rule (Nesto). This involves doing the following:
Take the value of the home you’re considering
Multiply by roughly 5% per year
Divide by 12 to get an approximate monthly cost of owning before principal
That 5% loosely bundles together property taxes, maintenance and repairs, and insurance and other recurring ownership costs.
If comparable rent is well below this 5%‑based monthly cost, renting often makes more financial sense (especially over shorter time horizons). If rent is well above that number, owning may be more attractive, assuming you stay long enough to offset transaction costs.
Rent vs Buy Break‑Even Checklist
Before going through a detailed calculation, let’s go through a practical checklist that you can work through with your numbers to get a gut check of the rent vs buy comparison.
1. Time Horizon
Do you expect to stay in this city/neighbourhood for at least 7–10 years?
Are there potential career, family, or lifestyle changes that might force a move sooner?
Short horizons (under 5–7 years) usually favor renting, because transaction costs and slow early principal paydown work against owners.
2. All‑In Monthly Ownership Cost
For the specific home you’re considering, calculate:
Mortgage payment (principal + interest)
Property tax (annual ÷ 12)
Home insurance (annual ÷ 12)
Maintenance reserve (1–3% of home value ÷ 12)
Condo/HOA fees, if any
Checklist question:
Is this all‑in monthly cost significantly higher than renting a comparable place?
If yes, can you realistically invest that difference every month as a renter?
3. Upfront Cash and Opportunity Cost
List how much cash you’d need to buy:
Down payment
Closing costs (legal, inspections, etc.)
Moving and basic setup costs
Then ask:
If I rented instead, could this money be invested in diversified index funds?
Over my expected time horizon, what might that grow to at a reasonable assumed return?
This is the opportunity cost of turning liquid, flexible capital into illiquid home equity.
4. Future Flexibility and Risk Tolerance
Consider:
How secure is your job or income?
Would a large, fixed housing payment stress your budget?
How comfortable are you with potential large, unexpected expenses (roof, HVAC, big repair)?
If you’re risk‑averse or in a volatile industry, the flexibility of renting and not being locked into a single asset can be a major advantage.
5. Lifestyle and Non‑Financial Priorities
Ask yourself:
Do you value being able to customize, renovate, and control your space?
Or do you value flexibility, travel, and not being tied to one location?
Owning often shines when you deeply value stability and control. Renting shines when you value optionality and mobility.
6. Break‑Even Thinking
To roughly estimate your break‑even point, think in terms of
How many years it takes for your net home equity after selling costs to surpass the value of your invested savings as a renter (down payment + monthly difference invested)
You don’t need to model this by hand, but understanding the logic helps. The longer you stay put and the more your property grows after costs, the more ownership can eventually pull ahead. The shorter your stay and the more disciplined you are as an investor, the more renting can win.
Rent vs Buy Calculation
Now that we understand the phantom costs of home ownership and have our rent vs buy breakeven checklist, we can look at several online calculators that compare total cost of renting vs buying over time, include opportunity cost of investments, and estimate the break‑even year where buying starts to win.
Redfin Rent vs Buy Calculator– Includes initial, recurring, opportunity costs, and net proceeds, and shows when renting and buying costs converge over your time horizon
Trulia Rent vs Buy Calculator– Calculates when you will break even and shows savings over specific periods in both monthly and total dollar terms
NerdWallet Rent vs Buy Calculator– Lets you adjust detailed assumptions and shows whether renting or buying is cheaper over time with a visual break‑even chart
RentCafe Rent vs Buy Calculator– Includes rent inflation, ownership costs, and opportunity cost, and summarizes average net cost per month for both paths
Leader Bank Rent vs Buy Calculator– Explicitly models the renter investing their savings and compares that to home equity net of selling costs, which aligns nicely with your “opportunity cost of home equity” theme
LRG Realty Break‑Even Calculator– Focuses explicitly on the break‑even concept and emphasizes after‑cost equity vs a renter’s invested cash path
For the stock‑market angle (S&P 500 vs mortgage / home equity):
Mortgage vs S&P 500 Investment Calculator (Wall Street Dragons)– Compares home equity and mortgage gains versus investing the same cash in the S&P 500, after accounting for ownership costs
Real Estate vs Stocks / S&P 500 ROI calculators– Some tools model a 10‑year comparison of real estate versus investing in an S&P 500 ETF using your actual upfront and ongoing cost inputs
Does Buying Ever Make Sense?
Despite all the phantom costs, buying isn’t inherently bad — it’s just not automatically superior. Home ownership can make solid sense when:
You expect to stay in the home for at least a decade
Your all‑in housing costs don’t leave you “house poor”
You can comfortably save and invest on top of your mortgage and expenses
You highly value stability, control over your living space, and the emotional satisfaction of ownership
In that scenario, the home becomes a hybrid: part investment, part consumption, part lifestyle choice. You’re not just buying an asset; you’re buying how you want to live.
I’ve included a very simple rent vs buy comparison example at the end as an Appendix for extra clarity.
The rent vs buy decision is not a moral test or a maturity milestone. It’s a trade‑off between:
Flexibility vs permanence
Liquidity vs illiquidity
Diversified investments vs concentrated real estate exposure
Known, limited risk vs large, lumpy potential costs
For many people, especially in today’s high‑priced markets, renting while aggressively investing the savings can be a more powerful wealth‑building strategy than stretching to buy and ending up house poor. Owning a house isn’t a default for achieving financial freedom or living the North American dream, because for many people, owning a house will be exactly that: a dream.
——————————————
Appendix: Example Rent vs. Buy Calculation
Let’s run through a simple example to compare owning versus renting for the same type of home in a particular market:
Option 1: Rent for $2,500 per month.
Option 2: Buy a similar home with an all‑in monthly cost of $3,500.
We’ll assume the $3,500 ownership cost already includes:
Mortgage payment (principal + interest)
Property taxes
Home insurance
A maintenance reserve
Any condo/HOA fees
The key is what you do with the $1,000 monthly difference.
Year 1 Snapshot
The renter pays $2,500 per month for shelter and invests the $1,000 difference into a broad, low‑cost index fund every month
The owner pays $3,500 per month for shelter, with only a portion of the mortgage payment actually reducing principal. The rest goes to interest and other phantom costs
At the end of Year 1:
The renter has:
$12,000 invested ($1,000 × 12), plus any market growth
The owner has:
Some principal paid down (equity)
But has also paid a lot in mortgage interest, property tax, insurance, and maintenance — none of which builds equity
On a one‑year horizon, renting almost always wins because transaction costs and slow early principal paydown drag on the owner.
5‑Year Horizon
Now extend this over 5 years:
The renter continues to:
Pay $2,500 per month
Invest $1,000 per month, building up a sizeable investment portfolio
The owner continues to:
Pay $3,500 per month
Gradually build home equity as more of the mortgage payment goes toward principal each year
After 5 years, you can compare:
Renter’s position:
Value of their investment account (down payment they never tied up, if any, plus $1,000 per month invested for 60 months, plus growth)
Owner’s position:
Net home equity (principal paid down + any home price appreciation − selling costs if they moved)
If the housing market was flat or only modestly up, and if the renter actually invested the difference, the renter can easily come out ahead on net worth, even though they “own nothing” on paper. The owner’s equity is reduced by the mortgage interest paid, property taxes, insurance and maintenance, and realtor and legal fees if they sell at the 5‑year mark.
10‑Year Horizon
Over 10 years, ownership has more time to catch up (and sometimes surpass renting), but it still depends on:
Strong, above‑inflation home price growth and reasonable interest rates favor the owner
Strong market returns on the renter’s invested surplus, modest rent increases, and high phantom costs favor the renter
At this stage, the break‑even point is where the owner’s net equity after selling costs roughly equals the renter’s invested portfolio value. If it takes more than 8–10 years for the owner to catch up in your numbers, that’s a strong signal that renting plus investing may be the better path for many people in that particular market and price band.
This example can be reused for any housing market scenario by simply swapping in:
Local typical rent for a given property type
Realistic all‑in ownership cost for a similar property
Preferred assumptions for rental rate growth, property appreciation, and investment returns
The structure stays the same: compare monthly spread, assume the renter invests it, and then look at how long it takes for ownership to realistically pull ahead after all costs.
——————————————